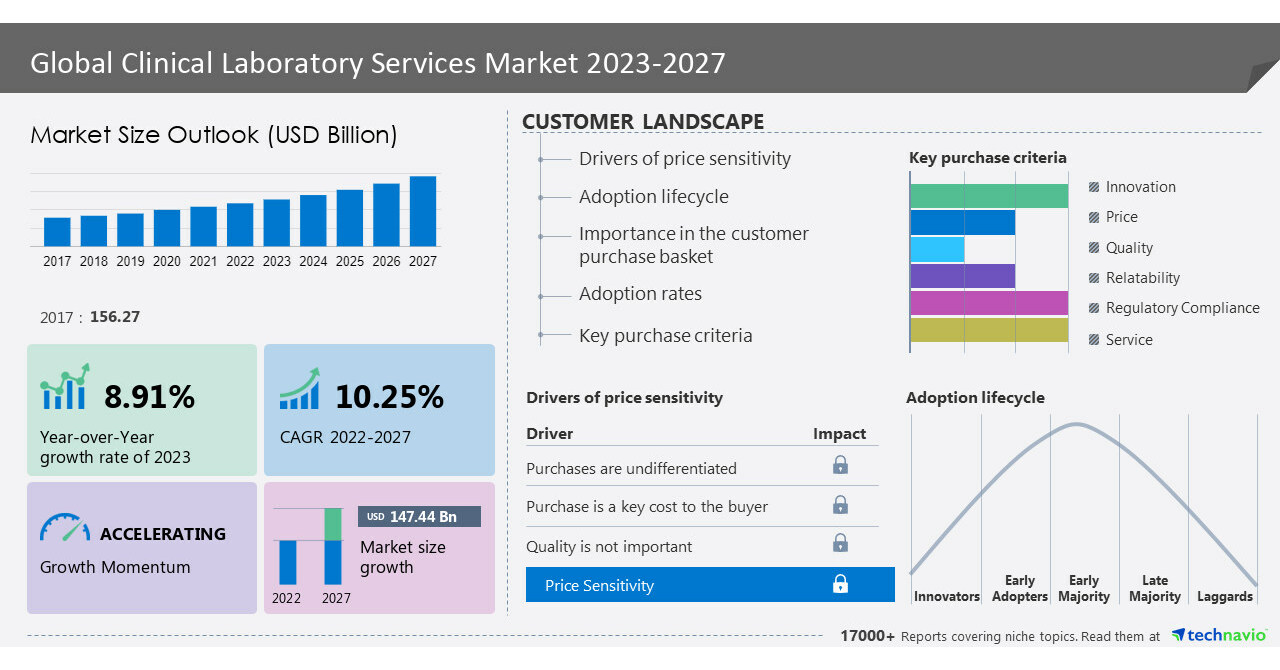
NEW YORK, May 15, 2023 /PRNewswire/ — The clinical laboratory services market is set to grow by USD 147.44 billion from 2022 to 2027. The market is expected to be progressing at a CAGR of 10.25% during the forecast period. The report offers an up-to-date analysis regarding the current global market scenario, the latest trends and drivers, and the overall market environment. The advent of automation and laboratory robotics significantly drive market growth. Laboratory automation is a result of the development of laboratory robotics and diagnostic and testing procedures are now more effective and efficient due to robotics. This is so that large-scale biorepositories, combinatorial chemistry, automated clinical and analytical testing, and high-throughput screening can all be done in automated laboratories. Hence, such factors will drive the growth of the global market during the forecast period. – Here is an Exclusive report talking about Market scenarios with a historical period (2017-2021) and a forecast period (2023-2027). Download Sample Report in minutes!
The clinical laboratory services market covers the following areas:
Clinical Laboratory Services Market Sizing
Clinical Laboratory Services Market Forecast
Clinical Laboratory Services Market Analysis
The report on the clinical laboratory services market provides a holistic update, market size and forecast, trends, growth drivers, and challenges, as well as vendor analysis.
Clinical Laboratory Services Market 2023-2027 – Market Dynamics
The increasing adoption of preventive healthcare is an emerging trend in the market growth. The adoption of preventive healthcare is increasing as a result of the rising prevalence of chronic diseases. Instead of treating diseases, preventive healthcare focuses on preventing them as it is possible to prevent disease with routine medical examinations. Thus, the use of routine medical tests is also expanding. As the main goal of routine checkups is to stop illnesses in their tracks. Depending on the patient’s age and gender, doctors may advise routine medical tests. For example, breast cancer is more likely to strike women between the ages of 38 and 42. Resultantly, it is advised that they undergo routine mammogram screening, which raises the demand for clinical laboratory services.
The lack of skilled professionals is a major challenge for the clinical laboratory services market growth. Clinical laboratory medicine professionals are skilled, certified individuals who have received training in both its theoretical and applied components, which include molecular pathology, chemistry, microbiology, immunology, and blood banking. Clinical laboratory professionals can work as staff technologists, research technologists, managers, supervisors, or educators, among other positions. They make between 60% and 70% of all medical decisions involving hospital admissions, discharge, diagnosis, and treatment. Hence, the lack of skilled professionals could affect the growth of the global market during the forecast period.
Clinical Laboratory Services Market 2023-2027 : Market Segmentation
This clinical laboratory services market report extensively covers market segmentation by end-user (hospital-based laboratories, stand-alone laboratories, and clinic-based laboratories), application (bioanalytical and lab chemistry, toxicology testing, cell and gene therapy, preclinical and clinical trial, and others), and geography (North America, Europe, Asia, and Rest of World (ROW).
- The market share growth by the hospital-based laboratories segment will be significant for overall market growth during the forecast period. As a result of collaboration, hospital-based laboratories get references from big hospitals. Hospital-based laboratories dominated a major share of the market in 2020 and to enhance operations, clinical laboratories collaborate with hospital laboratories. For example, the San Francisco General Hospital and the UCSF Medical Centre collaborated. Hence, such collaborations are beneficial to both hospitals and clinical laboratories, which will drive the adoption of hospital-based clinical laboratories during the forecast period.
This report presents a detailed picture of the market by the way of study, synthesis, and summation of data from multiple sources through an analysis of key parameters- View Sample Report
What’s New? –
- Special coverage on the Russia–Ukraine war; global inflation; recovery analysis from COVID-19; supply chain disruptions, global trade tensions; and risk of recession
- Global competitiveness and key competitor positions
- Market presence across multiple geographical footprints – Strong/Active/Niche/Trivial - Buy the report!
Companies Mentioned
- Abbott Laboratories
- AP Moller Holding AS
- ARUP Laboratories
- Bio Rad Laboratories Inc.
- Cerba HealthCare
- Charles River Laboratories International Inc.
- Enzo Clinical Labs
- Eurofins Scientific SE
- Fresenius Medical Care AG and Co. KGaA
- Genova Diagnostics Inc.
- HU Group Holdings Inc.
- Illumina Inc.
- Laboratory Corp. of America Holdings
- NeoGenomics Laboratories Inc.
- OPKO Health Inc.
- QIAGEN NV
- Quest Diagnostics Inc.
- Siemens AG
- Sonic Healthcare Ltd.
- SYNLAB International GmbH
Vendor Offerings
- Abbott Laboratories – The company offers clinical laboratory services which provide highly reliable laboratory data to satisfy the needs of clinicians involved in medical practice.
- ARUP Laboratories – The company offers a broad test menu to support clinical trials related to molecular genetics, infectious disease, pain management, and among others.
- Bio Rad Laboratories Inc. – The company offers clinical laboratory services which are designed to detect disease and curb the spread of various infectious diseases related to viruses, parasites, and bacteria.
Gain instant access to 17,000+ market research reports.
Technavio’s SUBSCRIPTION platform
Related Reports:
The clinical trial support services market size is expected to increase by USD 8.37 billion from 2021 to 2026, and the market’s growth momentum will accelerate at a CAGR of 7.4%. Furthermore, this report extensively covers clinical trial support services market segmentation by application (phase 2, phase 3, phase 1, and phase 4), age group (adults (greater than 18 years), adolescents (10 to 18 years), and children (less than 10 years)), and geography (Europe, North America, Asia, and Rest of World (ROW)). The growth of the biopharmaceutical industry is notably driving the clinical trial support services market growth.
The clinical workflow solution market size is expected to increase by USD 9.76 billion from 2021 to 2026, and the market’s growth momentum will accelerate at a CAGR of 14.11%. Furthermore, this report extensively covers clinical workflow solution market segmentation by end-user (hospitals, long-term care facilities, and ambulatory care centers) and geography (North America, Europe, Asia, and the Rest of the World (ROW)). The advantages of clinical decision support solutions in enhancing patient care and safety are notably driving the clinical workflow solution market growth.
|
Clinical Laboratory Services Market Scope |
|
|
Report Coverage |
Details |
|
Base year |
2022 |
|
Historic period |
2017-2021 |
|
Forecast period |
2023-2027 |
|
Growth momentum & CAGR |
Accelerate at a CAGR of 10.25% |
|
Market growth 2023-2027 |
USD 147.44 billion |
|
Market structure |
Fragmented |
|
YoY growth 2022-2023(%) |
8.91 |
|
Regional analysis |
North America, Europe, Asia, and Rest of World (ROW) |
|
Performing market contribution |
North America at 38% |
|
Key countries |
US, UK, Germany, China, and Japan |
|
Competitive landscape |
Leading Vendors, Market Positioning of Vendors, Competitive Strategies, and Industry Risks |
|
Key companies profiled |
Abbott Laboratories, AP Moller Holding AS, ARUP Laboratories, Bio Rad Laboratories Inc., Cerba HealthCare, Charles River Laboratories International Inc., Enzo Clinical Labs, Eurofins Scientific SE, Fresenius Medical Care AG and Co. KGaA, Genova Diagnostics Inc., HU Group Holdings Inc., Illumina Inc., Laboratory Corp. of America Holdings, NeoGenomics Laboratories Inc., OPKO Health Inc., QIAGEN NV, Quest Diagnostics Inc., Siemens AG, Sonic Healthcare Ltd., and SYNLAB International GmbH |
|
Market dynamics |
Parent market analysis, Market growth inducers and obstacles, Fast-growing and slow-growing segment analysis, COVID-19 impact and recovery analysis and future consumer dynamics, Market condition analysis for forecast period |
|
Customization purview |
If our report has not included the data that you are looking for, you can reach out to our analysts and get segments customized. |
Key Topics Covered:
1 Executive Summary
- 1.1 Market overview
- Exhibit 01: Executive Summary – Chart on Market Overview
- Exhibit 02: Executive Summary – Data Table on Market Overview
- Exhibit 03: Executive Summary – Chart on Global Market Characteristics
- Exhibit 04: Executive Summary – Chart on Market by Geography
- Exhibit 05: Executive Summary – Chart on Market Segmentation by End-user
- Exhibit 06: Executive Summary – Chart on Market Segmentation by Application
- Exhibit 07: Executive Summary – Chart on Incremental Growth
- Exhibit 08: Executive Summary – Data Table on Incremental Growth
- Exhibit 09: Executive Summary – Chart on Vendor Market Positioning
2 Market Landscape
- 2.1 Market ecosystem
- Exhibit 10: Parent market
- Exhibit 11: Market Characteristics
3 Market Sizing
- 3.1 Market definition
- Exhibit 12: Offerings of vendors included in the market definition
- 3.2 Market segment analysis
- Exhibit 13: Market segments
- 3.4 Market outlook: Forecast for 2022-2027
- Exhibit 14: Chart on Global – Market size and forecast 2022-2027 ($ billion)
- Exhibit 15: Data Table on Global – Market size and forecast 2022-2027 ($ billion)
- Exhibit 16: Chart on Global Market: Year-over-year growth 2022-2027 (%)
- Exhibit 17: Data Table on Global Market: Year-over-year growth 2022-2027 (%)
4 Historic Market Size
- 4.1 Global Clinical Laboratory services market 2017 – 2021
- Exhibit 18: Historic Market Size – Data Table on Global Clinical Laboratory services market 2017 – 2021 ($ billion)
- 4.2 End-user Segment Analysis 2017 – 2021
- Exhibit 19: Historic Market Size – End-user Segment 2017 – 2021 ($ billion)
- 4.3 Application Segment Analysis 2017 – 2021
- Exhibit 20: Historic Market Size – Application Segment 2017 – 2021 ($ billion)
- 4.4 Geography Segment Analysis 2017 – 2021
- Exhibit 21: Historic Market Size – Geography Segment 2017 – 2021 ($ billion)
- 4.5 Country Segment Analysis 2017 – 2021
- Exhibit 22: Historic Market Size – Country Segment 2017 – 2021 ($ billion)
5 Five Forces Analysis
- 5.1 Five forces summary
- Exhibit 23: Five forces analysis – Comparison between 2022 and 2027
- 5.2 Bargaining power of buyers
- Exhibit 24: Chart on Bargaining power of buyers – Impact of key factors 2022 and 2027
- 5.3 Bargaining power of suppliers
- Exhibit 25: Bargaining power of suppliers – Impact of key factors in 2022 and 2027
- 5.4 Threat of new entrants
- Exhibit 26: Threat of new entrants – Impact of key factors in 2022 and 2027
- 5.5 Threat of substitutes
- Exhibit 27: Threat of substitutes – Impact of key factors in 2022 and 2027
- 5.6 Threat of rivalry
- Exhibit 28: Threat of rivalry – Impact of key factors in 2022 and 2027
- 5.7 Market condition
- Exhibit 29: Chart on Market condition – Five forces 2022 and 2027
6 Market Segmentation by End-user
- 6.1 Market segments
- Exhibit 30: Chart on End-user – Market share 2022-2027 (%)
- Exhibit 31: Data Table on End-user – Market share 2022-2027 (%)
- 6.2 Comparison by End-user
- Exhibit 32: Chart on Comparison by End-user
- Exhibit 33: Data Table on Comparison by End-user
- 6.3 Hospital-based laboratories – Market size and forecast 2022-2027
- Exhibit 34: Chart on Hospital-based laboratories – Market size and forecast 2022-2027 ($ billion)
- Exhibit 35: Data Table on Hospital-based laboratories – Market size and forecast 2022-2027 ($ billion)
- Exhibit 36: Chart on Hospital-based laboratories – Year-over-year growth 2022-2027 (%)
- Exhibit 37: Data Table on Hospital-based laboratories – Year-over-year growth 2022-2027 (%)
- 6.4 Stand-alone laboratories – Market size and forecast 2022-2027
- Exhibit 38: Chart on Stand-alone laboratories – Market size and forecast 2022-2027 ($ billion)
- Exhibit 39: Data Table on Stand-alone laboratories – Market size and forecast 2022-2027 ($ billion)
- Exhibit 40: Chart on Stand-alone laboratories – Year-over-year growth 2022-2027 (%)
- Exhibit 41: Data Table on Stand-alone laboratories – Year-over-year growth 2022-2027 (%)
- 6.5 Clinic-based laboratories – Market size and forecast 2022-2027
- Exhibit 42: Chart on Clinic-based laboratories – Market size and forecast 2022-2027 ($ billion)
- Exhibit 43: Data Table on Clinic-based laboratories – Market size and forecast 2022-2027 ($ billion)
- Exhibit 44: Chart on Clinic-based laboratories – Year-over-year growth 2022-2027 (%)
- Exhibit 45: Data Table on Clinic-based laboratories – Year-over-year growth 2022-2027 (%)
- 6.6 Market opportunity by End-user
- Exhibit 46: Market opportunity by End-user ($ billion)
- Exhibit 47: Data Table on Market opportunity by End-user ($ billion)
7 Market Segmentation by Application
- 7.1 Market segments
- Exhibit 48: Chart on Application – Market share 2022-2027 (%)
- Exhibit 49: Data Table on Application – Market share 2022-2027 (%)
- 7.2 Comparison by Application
- Exhibit 50: Chart on Comparison by Application
- Exhibit 51: Data Table on Comparison by Application
- 7.3 Bioanalytical and lab chemistry – Market size and forecast 2022-2027
- Exhibit 52: Chart on Bioanalytical and lab chemistry – Market size and forecast 2022-2027 ($ billion)
- Exhibit 53: Data Table on Bioanalytical and lab chemistry – Market size and forecast 2022-2027 ($ billion)
- Exhibit 54: Chart on Bioanalytical and lab chemistry – Year-over-year growth 2022-2027 (%)
- Exhibit 55: Data Table on Bioanalytical and lab chemistry – Year-over-year growth 2022-2027 (%)
- 7.4 Toxicology testing – Market size and forecast 2022-2027
- Exhibit 56: Chart on Toxicology testing – Market size and forecast 2022-2027 ($ billion)
- Exhibit 57: Data Table on Toxicology testing – Market size and forecast 2022-2027 ($ billion)
- Exhibit 58: Chart on Toxicology testing – Year-over-year growth 2022-2027 (%)
- Exhibit 59: Data Table on Toxicology testing – Year-over-year growth 2022-2027 (%)
- 7.5 Cell and gene therapy – Market size and forecast 2022-2027
- Exhibit 60: Chart on Cell and gene therapy – Market size and forecast 2022-2027 ($ billion)
- Exhibit 61: Data Table on Cell and gene therapy – Market size and forecast 2022-2027 ($ billion)
- Exhibit 62: Chart on Cell and gene therapy – Year-over-year growth 2022-2027 (%)
- Exhibit 63: Data Table on Cell and gene therapy – Year-over-year growth 2022-2027 (%)
- 7.6 Preclinical and clinical trial – Market size and forecast 2022-2027
- Exhibit 64: Chart on Preclinical and clinical trial – Market size and forecast 2022-2027 ($ billion)
- Exhibit 65: Data Table on Preclinical and clinical trial – Market size and forecast 2022-2027 ($ billion)
- Exhibit 66: Chart on Preclinical and clinical trial – Year-over-year growth 2022-2027 (%)
- Exhibit 67: Data Table on Preclinical and clinical trial – Year-over-year growth 2022-2027 (%)
- 7.7 Others – Market size and forecast 2022-2027
- Exhibit 68: Chart on Others – Market size and forecast 2022-2027 ($ billion)
- Exhibit 69: Data Table on Others – Market size and forecast 2022-2027 ($ billion)
- Exhibit 70: Chart on Others – Year-over-year growth 2022-2027 (%)
- Exhibit 71: Data Table on Others – Year-over-year growth 2022-2027 (%)
- 7.8 Market opportunity by Application
- Exhibit 72: Market opportunity by Application ($ billion)
- Exhibit 73: Data Table on Market opportunity by Application ($ billion)
8 Customer Landscape
- 8.1 Customer landscape overview
- Exhibit 74: Analysis of price sensitivity, lifecycle, customer purchase basket, adoption rates, and purchase criteria
9 Geographic Landscape
- 9.1 Geographic segmentation
- Exhibit 75: Chart on Market share by geography 2022-2027 (%)
- Exhibit 76: Data Table on Market share by geography 2022-2027 (%)
- 9.2 Geographic comparison
- Exhibit 77: Chart on Geographic comparison
- Exhibit 78: Data Table on Geographic comparison
- 9.3 North America – Market size and forecast 2022-2027
- Exhibit 79: Chart on North America – Market size and forecast 2022-2027 ($ billion)
- Exhibit 80: Data Table on North America – Market size and forecast 2022-2027 ($ billion)
- Exhibit 81: Chart on North America – Year-over-year growth 2022-2027 (%)
- Exhibit 82: Data Table on North America – Year-over-year growth 2022-2027 (%)
- 9.4 Europe – Market size and forecast 2022-2027
- Exhibit 83: Chart on Europe – Market size and forecast 2022-2027 ($ billion)
- Exhibit 84: Data Table on Europe – Market size and forecast 2022-2027 ($ billion)
- Exhibit 85: Chart on Europe – Year-over-year growth 2022-2027 (%)
- Exhibit 86: Data Table on Europe – Year-over-year growth 2022-2027 (%)
- 9.5 Asia – Market size and forecast 2022-2027
- Exhibit 87: Chart on Asia – Market size and forecast 2022-2027 ($ billion)
- Exhibit 88: Data Table on Asia – Market size and forecast 2022-2027 ($ billion)
- Exhibit 89: Chart on Asia – Year-over-year growth 2022-2027 (%)
- Exhibit 90: Data Table on Asia – Year-over-year growth 2022-2027 (%)
- 9.6 Rest of World (ROW) – Market size and forecast 2022-2027
- Exhibit 91: Chart on Rest of World (ROW) – Market size and forecast 2022-2027 ($ billion)
- Exhibit 92: Data Table on Rest of World (ROW) – Market size and forecast 2022-2027 ($ billion)
- Exhibit 93: Chart on Rest of World (ROW) – Year-over-year growth 2022-2027 (%)
- Exhibit 94: Data Table on Rest of World (ROW) – Year-over-year growth 2022-2027 (%)
- 9.7 US – Market size and forecast 2022-2027
- Exhibit 95: Chart on US – Market size and forecast 2022-2027 ($ billion)
- Exhibit 96: Data Table on US – Market size and forecast 2022-2027 ($ billion)
- Exhibit 97: Chart on US – Year-over-year growth 2022-2027 (%)
- Exhibit 98: Data Table on US – Year-over-year growth 2022-2027 (%)
- 9.8 UK – Market size and forecast 2022-2027
- Exhibit 99: Chart on UK – Market size and forecast 2022-2027 ($ billion)
- Exhibit 100: Data Table on UK – Market size and forecast 2022-2027 ($ billion)
- Exhibit 101: Chart on UK – Year-over-year growth 2022-2027 (%)
- Exhibit 102: Data Table on UK – Year-over-year growth 2022-2027 (%)
- 9.9 China – Market size and forecast 2022-2027
- Exhibit 103: Chart on China – Market size and forecast 2022-2027 ($ billion)
- Exhibit 104: Data Table on China – Market size and forecast 2022-2027 ($ billion)
- Exhibit 105: Chart on China – Year-over-year growth 2022-2027 (%)
- Exhibit 106: Data Table on China – Year-over-year growth 2022-2027 (%)
- 9.10 Germany – Market size and forecast 2022-2027
- Exhibit 107: Chart on Germany – Market size and forecast 2022-2027 ($ billion)
- Exhibit 108: Data Table on Germany – Market size and forecast 2022-2027 ($ billion)
- Exhibit 109: Chart on Germany – Year-over-year growth 2022-2027 (%)
- Exhibit 110: Data Table on Germany – Year-over-year growth 2022-2027 (%)
- 9.11 Japan – Market size and forecast 2022-2027
- Exhibit 111: Chart on Japan – Market size and forecast 2022-2027 ($ billion)
- Exhibit 112: Data Table on Japan – Market size and forecast 2022-2027 ($ billion)
- Exhibit 113: Chart on Japan – Year-over-year growth 2022-2027 (%)
- Exhibit 114: Data Table on Japan – Year-over-year growth 2022-2027 (%)
- 9.12 Market opportunity by geography
- Exhibit 115: Market opportunity by geography ($ billion)
- Exhibit 116: Data Tables on Market opportunity by geography ($ billion)
10 Drivers, Challenges, and Trends
- 10.3 Impact of drivers and challenges
- Exhibit 117: Impact of drivers and challenges in 2022 and 2027
11 Vendor Landscape
- 11.2 Vendor landscape
- Exhibit 118: Overview on Criticality of inputs and Factors of differentiation
- 11.3 Landscape disruption
- Exhibit 119: Overview on factors of disruption
- 11.4 Industry risks
- Exhibit 120: Impact of key risks on business
12 Vendor Analysis
- 12.1 Vendors covered
- Exhibit 121: Vendors covered
- 12.2 Market positioning of vendors
- Exhibit 122: Matrix on vendor position and classification
- 12.3 Abbott Laboratories
- Exhibit 123: Abbott Laboratories – Overview
- Exhibit 124: Abbott Laboratories – Business segments
- Exhibit 125: Abbott Laboratories – Key news
- Exhibit 126: Abbott Laboratories – Key offerings
- Exhibit 127: Abbott Laboratories – Segment focus
- 12.4 ARUP Laboratories
- Exhibit 128: ARUP Laboratories – Overview
- Exhibit 129: ARUP Laboratories – Product / Service
- Exhibit 130: ARUP Laboratories – Key offerings
- 12.5 Bio Rad Laboratories Inc.
- Exhibit 131: Bio Rad Laboratories Inc. – Overview
- Exhibit 132: Bio Rad Laboratories Inc. – Business segments
- Exhibit 133: Bio Rad Laboratories Inc. – Key news
- Exhibit 134: Bio Rad Laboratories Inc. – Key offerings
- Exhibit 135: Bio Rad Laboratories Inc. – Segment focus
- 12.6 Cerba HealthCare
- Exhibit 136: Cerba HealthCare – Overview
- Exhibit 137: Cerba HealthCare – Product / Service
- Exhibit 138: Cerba HealthCare – Key offerings
- 12.7 Charles River Laboratories International Inc.
- Exhibit 139: Charles River Laboratories International Inc. – Overview
- Exhibit 140: Charles River Laboratories International Inc. – Business segments
- Exhibit 141: Charles River Laboratories International Inc. – Key news
- Exhibit 142: Charles River Laboratories International Inc. – Key offerings
- Exhibit 143: Charles River Laboratories International Inc. – Segment focus
- 12.8 Eurofins Scientific SE
- Exhibit 144: Eurofins Scientific SE – Overview
- Exhibit 145: Eurofins Scientific SE – Business segments
- Exhibit 146: Eurofins Scientific SE – Key news
- Exhibit 147: Eurofins Scientific SE – Key offerings
- Exhibit 148: Eurofins Scientific SE – Segment focus
- 12.9 Fresenius Medical Care AG and Co. KGaA
- Exhibit 149: Fresenius Medical Care AG and Co. KGaA – Overview
- Exhibit 150: Fresenius Medical Care AG and Co. KGaA – Business segments
- Exhibit 151: Fresenius Medical Care AG and Co. KGaA – Key news
- Exhibit 152: Fresenius Medical Care AG and Co. KGaA – Key offerings
- Exhibit 153: Fresenius Medical Care AG and Co. KGaA – Segment focus
- 12.10 Illumina Inc.
- Exhibit 154: Illumina Inc. – Overview
- Exhibit 155: Illumina Inc. – Business segments
- Exhibit 156: Illumina Inc. – Key news
- Exhibit 157: Illumina Inc. – Key offerings
- Exhibit 158: Illumina Inc. – Segment focus
- 12.11 Laboratory Corp. of America Holdings
- Exhibit 159: Laboratory Corp. of America Holdings – Overview
- Exhibit 160: Laboratory Corp. of America Holdings – Business segments
- Exhibit 161: Laboratory Corp. of America Holdings – Key news
- Exhibit 162: Laboratory Corp. of America Holdings – Key offerings
- Exhibit 163: Laboratory Corp. of America Holdings – Segment focus
- 12.12 NeoGenomics Laboratories Inc.
- Exhibit 164: NeoGenomics Laboratories Inc. – Overview
- Exhibit 165: NeoGenomics Laboratories Inc. – Business segments
- Exhibit 166: NeoGenomics Laboratories Inc. – Key news
- Exhibit 167: NeoGenomics Laboratories Inc. – Key offerings
- Exhibit 168: NeoGenomics Laboratories Inc. – Segment focus
- 12.13 OPKO Health Inc.
- Exhibit 169: OPKO Health Inc. – Overview
- Exhibit 170: OPKO Health Inc. – Business segments
- Exhibit 171: OPKO Health Inc. – Key offerings
- Exhibit 172: OPKO Health Inc. – Segment focus
- 12.14 QIAGEN NV
- Exhibit 173: QIAGEN NV – Overview
- Exhibit 174: QIAGEN NV – Product / Service
- Exhibit 175: QIAGEN NV – Key news
- Exhibit 176: QIAGEN NV – Key offerings
- 12.15 Quest Diagnostics Inc.
- Exhibit 177: Quest Diagnostics Inc. – Overview
- Exhibit 178: Quest Diagnostics Inc. – Business segments
- Exhibit 179: Quest Diagnostics Inc. – Key offerings
- Exhibit 180: Quest Diagnostics Inc. – Segment focus
- 12.16 Siemens AG
- Exhibit 181: Siemens AG – Overview
- Exhibit 182: Siemens AG – Business segments
- Exhibit 183: Siemens AG – Key news
- Exhibit 184: Siemens AG – Key offerings
- Exhibit 185: Siemens AG – Segment focus
- 12.17 Sonic Healthcare Ltd.
- Exhibit 186: Sonic Healthcare Ltd. – Overview
- Exhibit 187: Sonic Healthcare Ltd. – Business segments
- Exhibit 188: Sonic Healthcare Ltd. – Key offerings
- Exhibit 189: Sonic Healthcare Ltd. – Segment focus
13 Appendix
- 13.1 Scope of the report
- 13.2 Inclusions and exclusions checklist
- Exhibit 190: Inclusions checklist
- Exhibit 191: Exclusions checklist
- 13.3 Currency conversion rates for US$
- Exhibit 192: Currency conversion rates for US$
- 13.4 Research methodology
- Exhibit 193: Research methodology
- Exhibit 194: Validation techniques employed for market sizing
- Exhibit 195: Information sources
- 13.5 List of abbreviations
- Exhibit 196: List of abbreviations
About Us
Technavio is a leading global technology research and advisory company. Their research and analysis focuses on emerging market trends and provides actionable insights to help businesses identify market opportunities and develop effective strategies to optimize their market positions. With over 500 specialized analysts, Technavio’s report library consists of more than 17,000 reports and counting, covering 800 technologies, spanning across 50 countries. Their client base consists of enterprises of all sizes, including more than 100 Fortune 500 companies. This growing client base relies on Technavio’s comprehensive coverage, extensive research, and actionable market insights to identify opportunities in existing and potential markets and assess their competitive positions within changing market scenarios.
Contact
Technavio Research
Jesse Maida
Media & Marketing Executive
US: +1 844 364 1100
UK: +44 203 893 3200
Email: [email protected]
Website: www.technavio.com/
SOURCE Technavio
