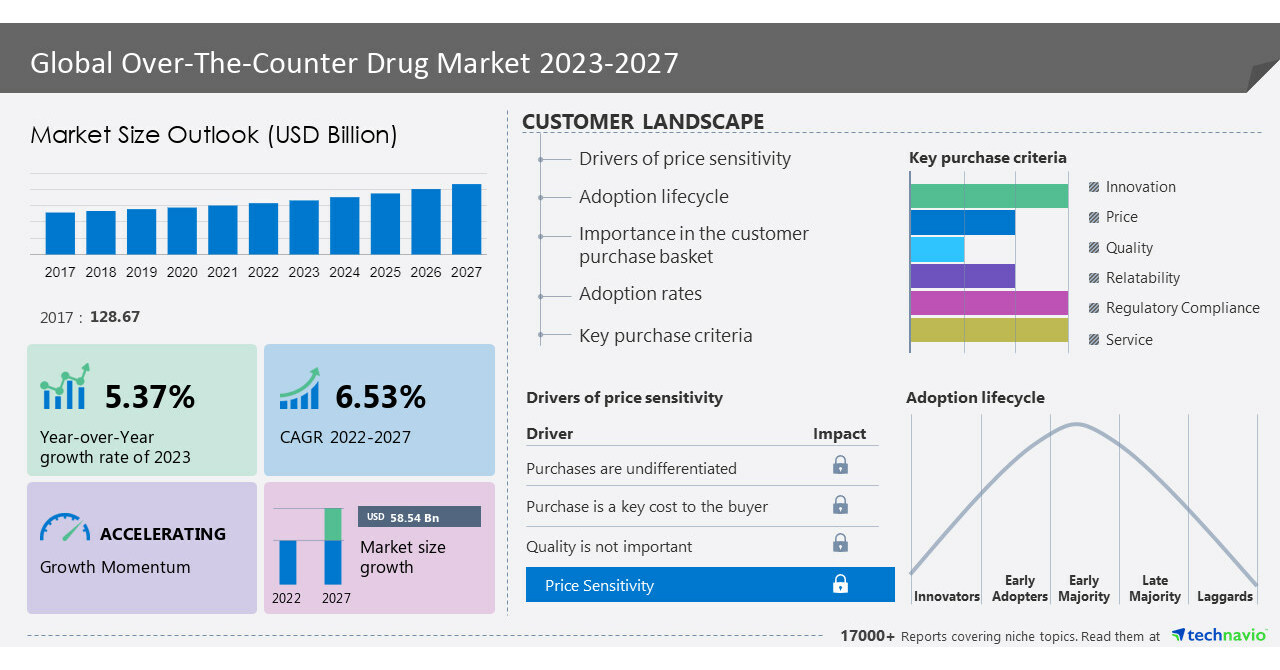
NEW YORK, May 17, 2023 /PRNewswire/ — The over-the-counter drug market size is set to grow by USD 58.54 billion from 2022 to 2027. The market is expected to register progress at a CAGR of 6.53%, according to Technavio’s latest market research report estimates. With a focus on identifying dominant industry influencers, Technavio’s reports present a detailed study by way of synthesis, and summation of data from multiple sources. Technavio offers in-depth market insights that assist global businesses to obtain growth opportunities. Read Sample Report
The report also covers the following areas:
Factors such as new product launches in the global over-the-counter drug market, rising prevalence of diseases and OTC drug use, and favorable regulatory framework for OTC drugs will offer immense growth opportunities. To leverage the current opportunities, market vendors must strengthen their foothold in the fast-growing segments, while maintaining their positions in the slow-growing segments. The over-the-counter drug market is fragmented, and the degree of fragmentation will accelerate during the forecast period.
Over-The-Counter Drug Market 2023-2027: Segmentation
The Over-The-Counter Drug is segmented by the following:
- Route Of Administration
- Oral
- Topical
- Parenteral
- Others
- Distribution Channel
- Geography
- North America
- Europe
- Asia
- Rest Of World (ROW)
The market share growth by the oral segment will be significant for overall market growth during the forecast period. The most practical, economical, and common method of drug administration is oral administration and these drugs are taken orally, either as tablets, capsules, or liquids. The small intestine is normally the major site of drug absorption. The amount of drug absorbed across the intestinal epithelium affects drug bioavailability, which is the most preferred route due to its advantages such as non-invasiveness, patient compliance, and convenience of drug delivery. Hence, such factors drive segment growth during the forecast period.
Learn more about the factors assisting the growth of the market, download a sample
report!
Over-The-Counter Drug Market 2023-2027: Vendor Analysis and Scope
Some of the major vendors of the over-the-counter drug market include Abbott Laboratories, Achelios Therapeutics Inc., AstraZeneca Plc, Bayer AG, BioGaia AB, Boehringer Ingelheim International GmbH, Bukwang Pharmaceutical Co. Ltd., Chr Hansen Holding AS, Cipla Ltd., CVS Health Corp., Eli Lilly and Co., GlaxoSmithKline Plc, Johnson and Johnson Services Inc., Lupin Ltd., Mankind Pharma Ltd., Novartis AG, Pfizer Inc., Reckitt Benckiser Group Plc, Sanofi SA, and Zydus Lifesciences Ltd. To help businesses improve their market position, Technavio’s report provides a detailed analysis of around 15+ vendors operating in the market. To leverage the current opportunities, market vendors must strengthen their foothold in the fast-growing segments, while maintaining their positions in the slow-growing segments. Backed with competitive intelligence and benchmarking, our research reports on the over-the-counter drug market are designed to provide entry support, customer profile & M&As as well as go-to-market strategy support.
What’s New? –
- Special coverage on the Russia–Ukraine war; global inflation; recovery analysis from COVID-19; supply chain disruptions, global trade tensions; and risk of recession
- Global competitiveness and key competitor positions
- Market presence across multiple geographical footprints – Strong/Active/Niche/Trivial – Buy the report!
Vendor Offerings
- Abbott Laboratories – The company offers over-the-counter drugs such as Abocal, Abocran, and Arinac.
- Achelios Therapeutics Inc. – The company offers over-the-counter drugs such as Topofen, Ditogel, and Topregel.
- AstraZeneca Plc – The company offers over-the-counter drugs namely ZOMIG-ZMT.
The over-the-counter drug market is fragmented, and the degree of fragmentation will accelerate. The new product launches in the global over-the-counter drug market will offer immense growth opportunities. However, the price sensitivity issues associated with OTC drugs will hamper the market growth.
Over-The-Counter Drug Market 2023-2027: Market Dynamics
Key Drivers
- The rising prevalence of diseases and OTC drug use significantly drive the over-the-counter (OTC) drug market growth.
- The worldwide prevalence of acute and chronic diseases including cardiovascular, neurological, orthopedic, and respiratory diseases is increasing significantly.
- Furthermore, more than 550,000 people in the United States are diagnosed with heart failure each year. According to the Centers for Disease Control and Prevention (CDC), approximately 790,000 people in the US have a heart attack each year.
- Of this, approximately 580,000 have a first heart attack and 210,000 have a recurrent heart attack.
- Hence, increasing chronic diseases across the globe will lead to increased demand for OTC drugs, which will boost the growth of the market during the forecast period.
Significant Trends
- The increasing geriatric population is an emerging trend influencing the over-the-counter drug market growth.
- The geriatric population around the world is increasing year by year. And, according to the World Health Organization (WHO), by 2050 it is projected to add about 1.5 billion people over the age of 65.
- This number is expected to increase in developing countries such as China, India, Japan, Bangladesh, and South Korea.
- Hence, the rising geriatric population is expected to drive the growth of the market during the forecast period.
Major Challenges
- Price sensitivity issues associated with over-the-counter (OTC) drugs are challenges that may hinder the OTC drug market growth.
- Customers are very price sensitive as OTC medicines are viewed as less necessary than prescription drugs, which results in them being more likely to opt for cheaper generic drugs or abandon treatment altogether.
- This puts pressure on manufacturers to keep prices low. This negatively impacts profit margins and may limit investment in R&D.
- Hence, price sensitivity is having a significant impact on the OTC drug market, limiting its potential for growth and innovation during the forecast period.
Over-The-Counter Drug Market 2023-2027: Key Highlights
- CAGR of the market during the forecast period 2023-2027
- Detailed information on factors that will assist over-the-counter drug market growth during the forecast period
- Estimation of the over-the-counter drug market size and its contribution to the parent market
- Predictions on upcoming trends and changes in consumer behavior
- The growth of the over-the-counter drug market
- Analysis of the market’s competitive landscape and detailed information on vendors
- Comprehensive details of factors that will challenge the growth of over-the-counter drug market vendors
Register for a free trial today and gain instant access to 17,000+ market research reports.
Technavio’s SUBSCRIPTION platform
Related Reports:
The advanced drug delivery systems market size is expected to increase to USD 91.79 billion from 2021 to 2026, at a CAGR of 7.41%. This advanced drug delivery systems market research report extensively covers advanced drug delivery systems market segmentation by type (oral, injection and inhalation, transdermal, carrier-based, and others) and geography (North America, Europe, Asia, and ROW). The rising chronic diseases are notably driving the advanced drug delivery systems market growth.
The injectable drug delivery devices market size is expected to increase by USD 22.29 billion from 2021 to 2026, at a CAGR of 8.48%. This injectable drug delivery devices market research report extensively covers market segmentation by type (advanced injectable drug delivery devices and conventional injectable drug delivery devices) and geography (North America, Europe, Asia, and ROW). The rising prevalence of chronic diseases is one of the key drivers supporting the injectable drug delivery devices market growth.
|
Over-The-Counter Drug Market Scope |
|
|
Report Coverage |
Details |
|
Base year |
2022 |
|
Historic period |
2017-2021 |
|
Forecast period |
2023-2027 |
|
Growth momentum & CAGR |
Accelerate at a CAGR of 6.53% |
|
Market growth 2023-2027 |
USD 58.54 billion |
|
Market structure |
Fragmented |
|
YoY growth 2022-2023(%) |
5.37 |
|
Regional analysis |
North America, Europe, Asia, and Rest of World (ROW) |
|
Performing market contribution |
North America at 41% |
|
Key countries |
US, Germany, UK, Japan, and China |
|
Competitive landscape |
Leading Vendors, Market Positioning of Vendors, Competitive Strategies, and Industry Risks |
|
Key companies profiled |
Abbott Laboratories, Achelios Therapeutics Inc., AstraZeneca Plc, Bayer AG, BioGaia AB, Boehringer Ingelheim International GmbH, Bukwang Pharmaceutical Co. Ltd., Chr Hansen Holding AS, Cipla Ltd., CVS Health Corp., Eli Lilly and Co., GlaxoSmithKline Plc, Johnson and Johnson Services Inc., Lupin Ltd., Mankind Pharma Ltd., Novartis AG, Pfizer Inc., Reckitt Benckiser Group Plc, Sanofi SA, and Zydus Lifesciences Ltd. |
|
Market dynamics |
Parent market analysis, Market growth inducers and obstacles, Fast-growing and slow-growing segment analysis, COVID-19 impact and recovery analysis and future consumer dynamics, Market condition analysis for forecast period |
|
Customization purview |
If our report has not included the data that you are looking for, you can reach out to our analysts and get segments customized. |
Table of Contents:
1 Executive Summary
- 1.1 Market overview
- Exhibit 01: Executive Summary – Chart on Market Overview
- Exhibit 02: Executive Summary – Data Table on Market Overview
- Exhibit 03: Executive Summary – Chart on Global Market Characteristics
- Exhibit 04: Executive Summary – Chart on Market by Geography
- Exhibit 05: Executive Summary – Chart on Market Segmentation by Route of Administration
- Exhibit 06: Executive Summary – Chart on Market Segmentation by Distribution Channel
- Exhibit 07: Executive Summary – Chart on Incremental Growth
- Exhibit 08: Executive Summary – Data Table on Incremental Growth
- Exhibit 09: Executive Summary – Chart on Vendor Market Positioning
2 Market Landscape
- 2.1 Market ecosystem
- Exhibit 10: Parent market
- Exhibit 11: Market Characteristics
3 Market Sizing
- 3.1 Market definition
- Exhibit 12: Offerings of vendors included in the market definition
- 3.2 Market segment analysis
- Exhibit 13: Market segments
- 3.4 Market outlook: Forecast for 2022-2027
- Exhibit 14: Chart on Global – Market size and forecast 2022-2027 ($ billion)
- Exhibit 15: Data Table on Global – Market size and forecast 2022-2027 ($ billion)
- Exhibit 16: Chart on Global Market: Year-over-year growth 2022-2027 (%)
- Exhibit 17: Data Table on Global Market: Year-over-year growth 2022-2027 (%)
4 Historic Market Size
- 4.1 Global over-the-counter drug market 2017 – 2021
- Exhibit 18: Historic Market Size – Data Table on global over-the-counter drug market 2017 – 2021 ($ billion)
- 4.2 Route of Administration Segment Analysis 2017 – 2021
- Exhibit 19: Historic Market Size – Route of Administration Segment 2017 – 2021 ($ billion)
- 4.3 Distribution Channel Segment Analysis 2017 – 2021
- Exhibit 20: Historic Market Size – Distribution Channel Segment 2017 – 2021 ($ billion)
- 4.4 Geography Segment Analysis 2017 – 2021
- Exhibit 21: Historic Market Size – Geography Segment 2017 – 2021 ($ billion)
- 4.5 Country Segment Analysis 2017 – 2021
- Exhibit 22: Historic Market Size – Country Segment 2017 – 2021 ($ billion)
5 Five Forces Analysis
- 5.1 Five forces summary
- Exhibit 23: Five forces analysis – Comparison between 2022 and 2027
- 5.2 Bargaining power of buyers
- Exhibit 24: Chart on Bargaining power of buyers – Impact of key factors 2022 and 2027
- 5.3 Bargaining power of suppliers
- Exhibit 25: Bargaining power of suppliers – Impact of key factors in 2022 and 2027
- 5.4 Threat of new entrants
- Exhibit 26: Threat of new entrants – Impact of key factors in 2022 and 2027
- 5.5 Threat of substitutes
- Exhibit 27: Threat of substitutes – Impact of key factors in 2022 and 2027
- 5.6 Threat of rivalry
- Exhibit 28: Threat of rivalry – Impact of key factors in 2022 and 2027
- 5.7 Market condition
- Exhibit 29: Chart on Market condition – Five forces 2022 and 2027
6 Market Segmentation by Route of Administration
- 6.1 Market segments
- Exhibit 30: Chart on Route of Administration – Market share 2022-2027 (%)
- Exhibit 31: Data Table on Route of Administration – Market share 2022-2027 (%)
- 6.2 Comparison by Route of Administration
- Exhibit 32: Chart on Comparison by Route of Administration
- Exhibit 33: Data Table on Comparison by Route of Administration
- 6.3 Oral – Market size and forecast 2022-2027
- Exhibit 34: Chart on Oral – Market size and forecast 2022-2027 ($ billion)
- Exhibit 35: Data Table on Oral – Market size and forecast 2022-2027 ($ billion)
- Exhibit 36: Chart on Oral – Year-over-year growth 2022-2027 (%)
- Exhibit 37: Data Table on Oral – Year-over-year growth 2022-2027 (%)
- 6.4 Topical – Market size and forecast 2022-2027
- Exhibit 38: Chart on Topical – Market size and forecast 2022-2027 ($ billion)
- Exhibit 39: Data Table on Topical – Market size and forecast 2022-2027 ($ billion)
- Exhibit 40: Chart on Topical – Year-over-year growth 2022-2027 (%)
- Exhibit 41: Data Table on Topical – Year-over-year growth 2022-2027 (%)
- 6.5 Parenteral – Market size and forecast 2022-2027
- Exhibit 42: Chart on Parenteral – Market size and forecast 2022-2027 ($ billion)
- Exhibit 43: Data Table on Parenteral – Market size and forecast 2022-2027 ($ billion)
- Exhibit 44: Chart on Parenteral – Year-over-year growth 2022-2027 (%)
- Exhibit 45: Data Table on Parenteral – Year-over-year growth 2022-2027 (%)
- 6.6 Others – Market size and forecast 2022-2027
- Exhibit 46: Chart on Others – Market size and forecast 2022-2027 ($ billion)
- Exhibit 47: Data Table on Others – Market size and forecast 2022-2027 ($ billion)
- Exhibit 48: Chart on Others – Year-over-year growth 2022-2027 (%)
- Exhibit 49: Data Table on Others – Year-over-year growth 2022-2027 (%)
- 6.7 Market opportunity by Route of Administration
- Exhibit 50: Market opportunity by Route of Administration ($ billion)
- Exhibit 51: Data Table on Market opportunity by Route of Administration ($ billion)
7 Market Segmentation by Distribution Channel
- 7.1 Market segments
- Exhibit 52: Chart on Distribution Channel – Market share 2022-2027 (%)
- Exhibit 53: Data Table on Distribution Channel – Market share 2022-2027 (%)
- 7.2 Comparison by Distribution Channel
- Exhibit 54: Chart on Comparison by Distribution Channel
- Exhibit 55: Data Table on Comparison by Distribution Channel
- 7.3 Offline – Market size and forecast 2022-2027
- Exhibit 56: Chart on Offline – Market size and forecast 2022-2027 ($ billion)
- Exhibit 57: Data Table on Offline – Market size and forecast 2022-2027 ($ billion)
- Exhibit 58: Chart on Offline – Year-over-year growth 2022-2027 (%)
- Exhibit 59: Data Table on Offline – Year-over-year growth 2022-2027 (%)
- 7.4 Online – Market size and forecast 2022-2027
- Exhibit 60: Chart on Online – Market size and forecast 2022-2027 ($ billion)
- Exhibit 61: Data Table on Online – Market size and forecast 2022-2027 ($ billion)
- Exhibit 62: Chart on Online – Year-over-year growth 2022-2027 (%)
- Exhibit 63: Data Table on Online – Year-over-year growth 2022-2027 (%)
- 7.5 Market opportunity by Distribution Channel
- Exhibit 64: Market opportunity by Distribution Channel ($ billion)
- Exhibit 65: Data Table on Market opportunity by Distribution Channel ($ billion)
8 Customer Landscape
- 8.1 Customer landscape overview
- Exhibit 66: Analysis of price sensitivity, lifecycle, customer purchase basket, adoption rates, and purchase criteria
9 Geographic Landscape
- 9.1 Geographic segmentation
- Exhibit 67: Chart on Market share by geography 2022-2027 (%)
- Exhibit 68: Data Table on Market share by geography 2022-2027 (%)
- 9.2 Geographic comparison
- Exhibit 69: Chart on Geographic comparison
- Exhibit 70: Data Table on Geographic comparison
- 9.3 North America – Market size and forecast 2022-2027
- Exhibit 71: Chart on North America – Market size and forecast 2022-2027 ($ billion)
- Exhibit 72: Data Table on North America – Market size and forecast 2022-2027 ($ billion)
- Exhibit 73: Chart on North America – Year-over-year growth 2022-2027 (%)
- Exhibit 74: Data Table on North America – Year-over-year growth 2022-2027 (%)
- 9.4 Europe – Market size and forecast 2022-2027
- Exhibit 75: Chart on Europe – Market size and forecast 2022-2027 ($ billion)
- Exhibit 76: Data Table on Europe – Market size and forecast 2022-2027 ($ billion)
- Exhibit 77: Chart on Europe – Year-over-year growth 2022-2027 (%)
- Exhibit 78: Data Table on Europe – Year-over-year growth 2022-2027 (%)
- 9.5 Asia – Market size and forecast 2022-2027
- Exhibit 79: Chart on Asia – Market size and forecast 2022-2027 ($ billion)
- Exhibit 80: Data Table on Asia – Market size and forecast 2022-2027 ($ billion)
- Exhibit 81: Chart on Asia – Year-over-year growth 2022-2027 (%)
- Exhibit 82: Data Table on Asia – Year-over-year growth 2022-2027 (%)
- 9.6 Rest of World (ROW) – Market size and forecast 2022-2027
- Exhibit 83: Chart on Rest of World (ROW) – Market size and forecast 2022-2027 ($ billion)
- Exhibit 84: Data Table on Rest of World (ROW) – Market size and forecast 2022-2027 ($ billion)
- Exhibit 85: Chart on Rest of World (ROW) – Year-over-year growth 2022-2027 (%)
- Exhibit 86: Data Table on Rest of World (ROW) – Year-over-year growth 2022-2027 (%)
- 9.7 US – Market size and forecast 2022-2027
- Exhibit 87: Chart on US – Market size and forecast 2022-2027 ($ billion)
- Exhibit 88: Data Table on US – Market size and forecast 2022-2027 ($ billion)
- Exhibit 89: Chart on US – Year-over-year growth 2022-2027 (%)
- Exhibit 90: Data Table on US – Year-over-year growth 2022-2027 (%)
- 9.8 Germany – Market size and forecast 2022-2027
- Exhibit 91: Chart on Germany – Market size and forecast 2022-2027 ($ billion)
- Exhibit 92: Data Table on Germany – Market size and forecast 2022-2027 ($ billion)
- Exhibit 93: Chart on Germany – Year-over-year growth 2022-2027 (%)
- Exhibit 94: Data Table on Germany – Year-over-year growth 2022-2027 (%)
- 9.9 Japan – Market size and forecast 2022-2027
- Exhibit 95: Chart on Japan – Market size and forecast 2022-2027 ($ billion)
- Exhibit 96: Data Table on Japan – Market size and forecast 2022-2027 ($ billion)
- Exhibit 97: Chart on Japan – Year-over-year growth 2022-2027 (%)
- Exhibit 98: Data Table on Japan – Year-over-year growth 2022-2027 (%)
- 9.10 UK – Market size and forecast 2022-2027
- Exhibit 99: Chart on UK – Market size and forecast 2022-2027 ($ billion)
- Exhibit 100: Data Table on UK – Market size and forecast 2022-2027 ($ billion)
- Exhibit 101: Chart on UK – Year-over-year growth 2022-2027 (%)
- Exhibit 102: Data Table on UK – Year-over-year growth 2022-2027 (%)
- 9.11 China – Market size and forecast 2022-2027
- Exhibit 103: Chart on China – Market size and forecast 2022-2027 ($ billion)
- Exhibit 104: Data Table on China – Market size and forecast 2022-2027 ($ billion)
- Exhibit 105: Chart on China – Year-over-year growth 2022-2027 (%)
- Exhibit 106: Data Table on China – Year-over-year growth 2022-2027 (%)
- 9.12 Market opportunity by geography
- Exhibit 107: Market opportunity by geography ($ billion)
- Exhibit 108: Data Tables on Market opportunity by geography ($ billion)
10 Drivers, Challenges, and Trends
- 10.3 Impact of drivers and challenges
- Exhibit 109: Impact of drivers and challenges in 2022 and 2027
11 Vendor Landscape
- 11.2 Vendor landscape
- Exhibit 110: Overview on Criticality of inputs and Factors of differentiation
- 11.3 Landscape disruption
- Exhibit 111: Overview on factors of disruption
- 11.4 Industry risks
- Exhibit 112: Impact of key risks on business
12 Vendor Analysis
- 12.1 Vendors covered
- Exhibit 113: Vendors covered
- 12.2 Market positioning of vendors
- Exhibit 114: Matrix on vendor position and classification
- 12.3 Abbott Laboratories
- Exhibit 115: Abbott Laboratories – Overview
- Exhibit 116: Abbott Laboratories – Business segments
- Exhibit 117: Abbott Laboratories – Key news
- Exhibit 118: Abbott Laboratories – Key offerings
- Exhibit 119: Abbott Laboratories – Segment focus
- 12.4 Achelios Therapeutics Inc.
- Exhibit 120: Achelios Therapeutics Inc. – Overview
- Exhibit 121: Achelios Therapeutics Inc. – Product / Service
- Exhibit 122: Achelios Therapeutics Inc. – Key offerings
- 12.5 AstraZeneca Plc
- Exhibit 123: AstraZeneca Plc – Overview
- Exhibit 124: AstraZeneca Plc – Product / Service
- Exhibit 125: AstraZeneca Plc – Key news
- Exhibit 126: AstraZeneca Plc – Key offerings
- 12.6 Bayer AG
- Exhibit 127: Bayer AG – Overview
- Exhibit 128: Bayer AG – Business segments
- Exhibit 129: Bayer AG – Key news
- Exhibit 130: Bayer AG – Key offerings
- Exhibit 131: Bayer AG – Segment focus
- 12.7 BioGaia AB
- Exhibit 132: BioGaia AB – Overview
- Exhibit 133: BioGaia AB – Business segments
- Exhibit 134: BioGaia AB – Key news
- Exhibit 135: BioGaia AB – Key offerings
- Exhibit 136: BioGaia AB – Segment focus
- 12.8 Boehringer Ingelheim International GmbH
- Exhibit 137: Boehringer Ingelheim International GmbH – Overview
- Exhibit 138: Boehringer Ingelheim International GmbH – Business segments
- Exhibit 139: Boehringer Ingelheim International GmbH – Key news
- Exhibit 140: Boehringer Ingelheim International GmbH – Key offerings
- Exhibit 141: Boehringer Ingelheim International GmbH – Segment focus
- 12.9 Bukwang Pharmaceutical Co. Ltd.
- Exhibit 142: Bukwang Pharmaceutical Co. Ltd. – Overview
- Exhibit 143: Bukwang Pharmaceutical Co. Ltd. – Product / Service
- Exhibit 144: Bukwang Pharmaceutical Co. Ltd. – Key offerings
- 12.10 Chr Hansen Holding AS
- Exhibit 145: Chr Hansen Holding AS – Overview
- Exhibit 146: Chr Hansen Holding AS – Business segments
- Exhibit 147: Chr Hansen Holding AS – Key news
- Exhibit 148: Chr Hansen Holding AS – Key offerings
- Exhibit 149: Chr Hansen Holding AS – Segment focus
- 12.11 CVS Health Corp.
- Exhibit 150: CVS Health Corp. – Overview
- Exhibit 151: CVS Health Corp. – Business segments
- Exhibit 152: CVS Health Corp. – Key news
- Exhibit 153: CVS Health Corp. – Key offerings
- Exhibit 154: CVS Health Corp. – Segment focus
- 12.12 GlaxoSmithKline Plc
- Exhibit 155: GlaxoSmithKline Plc – Overview
- Exhibit 156: GlaxoSmithKline Plc – Business segments
- Exhibit 157: GlaxoSmithKline Plc – Key news
- Exhibit 158: GlaxoSmithKline Plc – Key offerings
- Exhibit 159: GlaxoSmithKline Plc – Segment focus
- 12.13 Johnson and Johnson Services Inc.
- Exhibit 160: Johnson and Johnson Services Inc. – Overview
- Exhibit 161: Johnson and Johnson Services Inc. – Business segments
- Exhibit 162: Johnson and Johnson Services Inc. – Key news
- Exhibit 163: Johnson and Johnson Services Inc. – Key offerings
- Exhibit 164: Johnson and Johnson Services Inc. – Segment focus
- 12.14 Novartis AG
- Exhibit 165: Novartis AG – Overview
- Exhibit 166: Novartis AG – Business segments
- Exhibit 167: Novartis AG – Key offerings
- Exhibit 168: Novartis AG – Segment focus
- 12.15 Pfizer Inc.
- Exhibit 169: Pfizer Inc. – Overview
- Exhibit 170: Pfizer Inc. – Product / Service
- Exhibit 171: Pfizer Inc. – Key news
- Exhibit 172: Pfizer Inc. – Key offerings
- 12.16 Reckitt Benckiser Group Plc
- Exhibit 173: Reckitt Benckiser Group Plc – Overview
- Exhibit 174: Reckitt Benckiser Group Plc – Business segments
- Exhibit 175: Reckitt Benckiser Group Plc – Key offerings
- Exhibit 176: Reckitt Benckiser Group Plc – Segment focus
- 12.17 Sanofi SA
- Exhibit 177: Sanofi SA – Overview
- Exhibit 178: Sanofi SA – Business segments
- Exhibit 179: Sanofi SA – Key news
- Exhibit 180: Sanofi SA – Key offerings
- Exhibit 181: Sanofi SA – Segment focus
13 Appendix
- 13.1 Scope of the report
- 13.2 Inclusions and exclusions checklist
- Exhibit 182: Inclusions checklist
- Exhibit 183: Exclusions checklist
- 13.3 Currency conversion rates for US$
- Exhibit 184: Currency conversion rates for US$
- 13.4 Research methodology
- Exhibit 185: Research methodology
- Exhibit 186: Validation techniques employed for market sizing
- Exhibit 187: Information sources
- 13.5 List of abbreviations
- Exhibit 188: List of abbreviations
About Us
Technavio is a leading global technology research and advisory company. Their research and analysis focus on emerging market trends and provides actionable insights to help businesses identify market opportunities and develop effective strategies to optimize their market positions. With over 500 specialized analysts, Technavio’s report library consists of more than 17,000 reports and counting, covering 800 technologies, spanning across 50 countries. Their client base consists of enterprises of all sizes, including more than 100 Fortune 500 companies. This growing client base relies on Technavio’s comprehensive coverage, extensive research, and actionable market insights to identify opportunities in existing and potential markets and assess their competitive positions within changing market scenarios.
Contact
Technavio Research
Jesse Maida
Media & Marketing Executive
US: +1 844 364 1100
UK: +44 203 893 3200
Email: [email protected]
Website: www.technavio.com/
SOURCE Technavio
