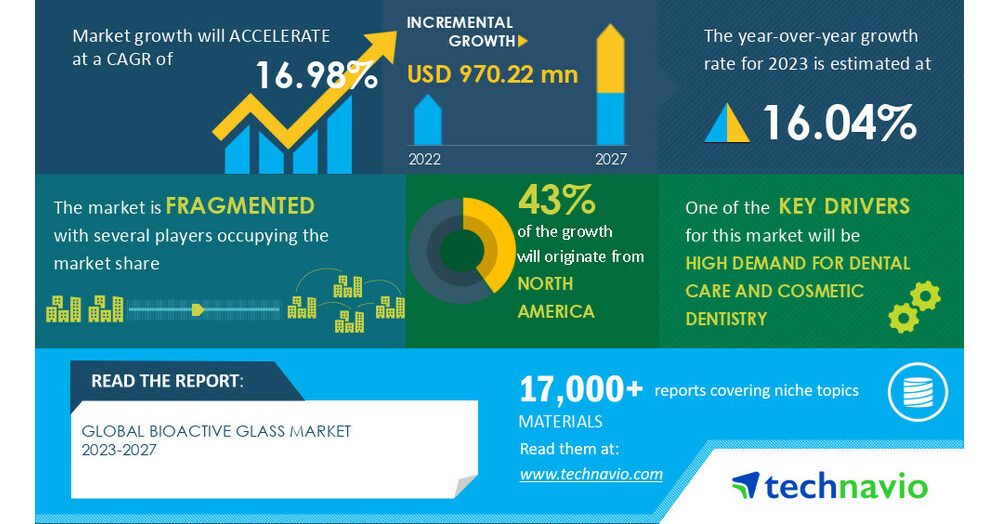
NEW YORK, June 6, 2023 /PRNewswire/ — The global bioactive glass market size is estimated to grow by USD 970.22 million from 2022 to 2027, according to Technavio. The market is estimated to grow at a CAGR of 16.98% during the forecast period. North America is estimated to account for 43% of the global market growth during the forecast period. Owing to factors such as the increasing prevalence of dental disease, the growing popularity of dental procedures, and growing awareness and interest in oral health, the market is growing significantly. The number of product approvals, the strong presence of established suppliers such as Zimmer and Stryker, and the increasing prevalence of dental disease and related risk factors all contribute to the regional market growth during the forecast period. Additionally, rising healthcare costs and an increase in dentists and dental facilities boost the market growth in the region.
For more insights on the historic period (2017 to 2021) and forecast market size (2023 to 2027) – Request a sample report
What’s New?
- Special coverage on the Russia–Ukraine war; global inflation; recovery analysis from COVID-19; supply chain disruptions, global trade tensions; and risk of recession
- Global competitiveness and key competitor positions
- Market presence across multiple geographical footprints – Strong/Active/Niche/Trivial – buy the report!
Bioactive Glass Market – Segmentation Assessment
Segment Overview
Technavio has segmented the market based on product (silicate-based glass, phosphate-based glass, and borate-based glass), application (medical, dentistry, cosmetics, and others), and geography (North America, Europe, Asia, and Rest of World (ROW)).
- The market share growth by the silicate-based glass segment will be significant for overall market growth during the forecast period. This segment experiences demand in dental and orthopedic surgery as they aid in bone regeneration. Some of the major orthopedic diseases requiring the use of silicate-based bioactive glasses include lower extremity fractures and dislocations, total and partial hip replacements, and spinal fusions. This type of glass is also used for spinal fixation after cervical and lumbar surgery. Furthermore, the biomaterial transmits low-level electrical signals to stimulate the natural bone healing process. Hence, such a wide range of applications drives the demand for the silicate-based glass segment during the forecast period.
Insights on the market contribution of various segments, including country and region wise historic data (2017 to 2021), and forecast market size (2023 to 2027) – Download a Sample Report
Bioactive Glass Market – Market Dynamics
Key factor driving market growth
High demand for dental care and cosmetic dentistry notably drives the bioactive glass market growth. There is a high incidence of oral diseases, such as periodontal disease, which can lead to tooth loss and infection. This results in high demand for dental care techniques such as dental implants, dental bridges, and dentures to maintain oral care and treat dental problems.
Furthermore, advances in dental technology, such as teledentistry, digital x-rays, lasers, and the inclusion of dental insurance in the National Health Insurance (NHI) bill are other factors driving the growth of the market. This increases the demand for bioactive glasses used in dental implants, driving the growth of the market during the forecast period.
Leading trends influencing the market
Inorganic growth strategies by the vendors are an emerging trend in the bioactive glass market growth. Vendors implement various strategies to expand their product portfolio such as mergers and acquisitions to increase market presence and sales of the orthodontic product line. They also collaborate with other companies and research institutes to develop new technologies, enhance their product offerings, and expand their distribution networks. These strategies offer vendors an opportunity to increase their profit margins.
For instance, Heraeus Group announced the acquisition of Mo-Sci Corp, which is a major player in the supply of medical and specialty glass. hence, such trends influence the growth of the bioactive glass market during the forecast period.
Major challenges hindering the market growth
Stringent regulations and product recalls of bioactive glass challenge the bioactive glass market growth. A strict regulatory framework on bioactive glasses is imposed by the regulatory bodies. Before medical devices get approved, they must undergo safety and efficacy evaluations. However, failure to comply with such regulations and laws may hinder new product launches, adversely affecting market growth.
Thus, the sterility of bioactive glasses is a major concern for manufacturers and distributors. Recalls have resulted in corrective procedures for the patient on several occasions. Hence, such challenges impede the growth of the bioactive glass market during the forecast period.
Insights on Market Drivers, trends, & Challenges, historic period(2017 to 2021), and forecast period(2023 to 2027)- Request a sample report!
What are the key data covered in this Bioactive Glass Market report?
- CAGR of the market during the forecast period
- Detailed information on factors that will drive the growth of the bioactive glass market between 2023 and 2027
- Precise estimation of the size of the bioactive glass market and its contribution to the market with a focus on the parent market
- Accurate predictions about upcoming trends and changes in consumer behavior
- Growth of the bioactive glass market across North America, Europe, Asia, and Rest of World (ROW)
- A thorough analysis of the market’s competitive landscape and detailed information about vendors
- Comprehensive analysis of factors that will challenge the growth of bioactive glass market vendors
Gain instant access to 17,000+ market research reports.
Technavio’s SUBSCRIPTION platform
Related Reports:
The glass bottles and containers market size is estimated to grow at a CAGR of 4.07% between 2022 and 2027. The market size is forecast to increase by USD 14.51 billion. This glass bottles and containers market report extensively covers market segmentation by type (transparent glass and opaque glass), end-user (beverage packaging, cosmetics and perfumes, pharmaceuticals, food packaging, and others), and geography (North America, APAC, Europe, Middle East and Africa, and South America). The increasing demand for sustainable packaging products is notably driving the market growth.
The bioactive wound dressing market size is expected to increase by USD 1.17 billion from 2021 to 2026, and the market’s growth momentum will accelerate at a CAGR of 5.63%. Furthermore, this report extensively covers bioactive wound dressing market segmentation by type (moist wound care, active wound care, and antimicrobial care) and geography (North America, Europe, Asia, and Rest of World (ROW)). The increasing prevalence of acute and chronic wounds is notably driving the bioactive wound dressing market growth.
|
Bioactive Glass Market Scope |
|
|
Report Coverage |
Details |
|
Base year |
2022 |
|
Historic period |
2017-2021 |
|
Forecast period |
2023-2027 |
|
Growth momentum & CAGR |
Accelerate at a CAGR of 16.98% |
|
Market growth 2023-2027 |
USD 970.22 million |
|
Market structure |
Fragmented |
|
YoY growth 2022-2023 (%) |
16.04 |
|
Regional analysis |
North America, Europe, Asia, and Rest of World (ROW) |
|
Performing market contribution |
North America at 43% |
|
Key countries |
US, UK, China, India, and Japan, Canada, Mexico, Italy,Spain, India, Japan, Australia, and South Korea |
|
Competitive landscape |
Leading Vendors, Market Positioning of Vendors, Competitive Strategies, and Industry Risks |
|
Key companies profiled |
Arthrex Inc., BioMin Technologies Ltd., Bonalive Biomaterials Ltd., Curasan Inc., Ferro Corp., GlaxoSmithKline Plc, Johnson and Johnson Services Inc., Koninklijke DSM NV, LASAK s.r.o., Matexcel, Merck KGaA, Mo-Sci Corp., NanoFUSE Biologics LLC, NORAKER, NovaBone Products LLC, Pulpdent Corp., SCHOTT AG, Stryker Corp., Synergy Biomedical LLC, and Zimmer Biomet Holdings Inc. |
|
Market dynamics |
Parent market analysis, Market growth inducers and obstacles, Fast-growing and slow-growing segment analysis, COVID-19 impact and recovery analysis and future consumer dynamics, Market condition analysis for forecast period. |
|
Customization purview |
If our report has not included the data that you are looking for, you can reach out to our analysts and get segments customized. |
Table of Contents
1 Executive Summary
- 1.1 Market overview
- Exhibit 01: Executive Summary – Chart on Market Overview
- Exhibit 02: Executive Summary – Data Table on Market Overview
- Exhibit 03: Executive Summary – Chart on Global Market Characteristics
- Exhibit 04: Executive Summary – Chart on Market by Geography
- Exhibit 05: Executive Summary – Chart on Market Segmentation by Product
- Exhibit 06: Executive Summary – Chart on Market Segmentation by Application
- Exhibit 07: Executive Summary – Chart on Incremental Growth
- Exhibit 08: Executive Summary – Data Table on Incremental Growth
- Exhibit 09: Executive Summary – Chart on Vendor Market Positioning
2 Market Landscape
- 2.1 Market ecosystem
- Exhibit 10: Parent market
- Exhibit 11: Market Characteristics
3 Market Sizing
- 3.1 Market definition
- Exhibit 12: Offerings of vendors included in the market definition
- 3.2 Market segment analysis
- Exhibit 13: Market segments
- 3.4 Market outlook: Forecast for 2022-2027
- Exhibit 14: Chart on Global – Market size and forecast 2022-2027 ($ million)
- Exhibit 15: Data Table on Global – Market size and forecast 2022-2027 ($ million)
- Exhibit 16: Chart on Global Market: Year-over-year growth 2022-2027 (%)
- Exhibit 17: Data Table on Global Market: Year-over-year growth 2022-2027 (%)
4 Historic Market Size
- 4.1 Global bioactive glass market 2017 – 2021
- Exhibit 18: Historic Market Size – Data Table on Global bioactive glass market 2017 – 2021 ($ million)
- 4.2 Product Segment Analysis 2017 – 2021
- Exhibit 19: Historic Market Size – Product Segment 2017 – 2021 ($ million)
- 4.3 Application Segment Analysis 2017 – 2021
- Exhibit 20: Historic Market Size – Application Segment 2017 – 2021 ($ million)
- 4.4 Geography Segment Analysis 2017 – 2021
- Exhibit 21: Historic Market Size – Geography Segment 2017 – 2021 ($ million)
- 4.5 Country Segment Analysis 2017 – 2021
- Exhibit 22: Historic Market Size – Country Segment 2017 – 2021 ($ million)
5 Five Forces Analysis
- 5.1 Five forces summary
- Exhibit 23: Five forces analysis – Comparison between 2022 and 2027
- 5.2 Bargaining power of buyers
- Exhibit 24: Chart on Bargaining power of buyers – Impact of key factors 2022 and 2027
- 5.3 Bargaining power of suppliers
- Exhibit 25: Bargaining power of suppliers – Impact of key factors in 2022 and 2027
- 5.4 Threat of new entrants
- Exhibit 26: Threat of new entrants – Impact of key factors in 2022 and 2027
- 5.5 Threat of substitutes
- Exhibit 27: Threat of substitutes – Impact of key factors in 2022 and 2027
- 5.6 Threat of rivalry
- Exhibit 28: Threat of rivalry – Impact of key factors in 2022 and 2027
- 5.7 Market condition
- Exhibit 29: Chart on Market condition – Five forces 2022 and 2027
6 Market Segmentation by Product
- 6.1 Market segments
- Exhibit 30: Chart on Product – Market share 2022-2027 (%)
- Exhibit 31: Data Table on Product – Market share 2022-2027 (%)
- 6.2 Comparison by Product
- Exhibit 32: Chart on Comparison by Product
- Exhibit 33: Data Table on Comparison by Product
- 6.3 Silicate-based glass – Market size and forecast 2022-2027
- Exhibit 34: Chart on Silicate-based glass – Market size and forecast 2022-2027 ($ million)
- Exhibit 35: Data Table on Silicate-based glass – Market size and forecast 2022-2027 ($ million)
- Exhibit 36: Chart on Silicate-based glass – Year-over-year growth 2022-2027 (%)
- Exhibit 37: Data Table on Silicate-based glass – Year-over-year growth 2022-2027 (%)
- 6.4 Phosphate-based glass – Market size and forecast 2022-2027
- Exhibit 38: Chart on Phosphate-based glass – Market size and forecast 2022-2027 ($ million)
- Exhibit 39: Data Table on Phosphate-based glass – Market size and forecast 2022-2027 ($ million)
- Exhibit 40: Chart on Phosphate-based glass – Year-over-year growth 2022-2027 (%)
- Exhibit 41: Data Table on Phosphate-based glass – Year-over-year growth 2022-2027 (%)
- 6.5 Borate-based glass – Market size and forecast 2022-2027
- Exhibit 42: Chart on Borate-based glass – Market size and forecast 2022-2027 ($ million)
- Exhibit 43: Data Table on Borate-based glass – Market size and forecast 2022-2027 ($ million)
- Exhibit 44: Chart on Borate-based glass – Year-over-year growth 2022-2027 (%)
- Exhibit 45: Data Table on Borate-based glass – Year-over-year growth 2022-2027 (%)
- 6.6 Market opportunity by Product
- Exhibit 46: Market opportunity by Product ($ million)
- Exhibit 47: Data Table on Market opportunity by Product ($ million)
7 Market Segmentation by Application
- 7.1 Market segments
- Exhibit 48: Chart on Application – Market share 2022-2027 (%)
- Exhibit 49: Data Table on Application – Market share 2022-2027 (%)
- 7.2 Comparison by Application
- Exhibit 50: Chart on Comparison by Application
- Exhibit 51: Data Table on Comparison by Application
- 7.3 Medical – Market size and forecast 2022-2027
- Exhibit 52: Chart on Medical – Market size and forecast 2022-2027 ($ million)
- Exhibit 53: Data Table on Medical – Market size and forecast 2022-2027 ($ million)
- Exhibit 54: Chart on Medical – Year-over-year growth 2022-2027 (%)
- Exhibit 55: Data Table on Medical – Year-over-year growth 2022-2027 (%)
- 7.4 Dentistry – Market size and forecast 2022-2027
- Exhibit 56: Chart on Dentistry – Market size and forecast 2022-2027 ($ million)
- Exhibit 57: Data Table on Dentistry – Market size and forecast 2022-2027 ($ million)
- Exhibit 58: Chart on Dentistry – Year-over-year growth 2022-2027 (%)
- Exhibit 59: Data Table on Dentistry – Year-over-year growth 2022-2027 (%)
- 7.5 Cosmetics – Market size and forecast 2022-2027
- Exhibit 60: Chart on Cosmetics – Market size and forecast 2022-2027 ($ million)
- Exhibit 61: Data Table on Cosmetics – Market size and forecast 2022-2027 ($ million)
- Exhibit 62: Chart on Cosmetics – Year-over-year growth 2022-2027 (%)
- Exhibit 63: Data Table on Cosmetics – Year-over-year growth 2022-2027 (%)
- 7.6 Others – Market size and forecast 2022-2027
- Exhibit 64: Chart on Others – Market size and forecast 2022-2027 ($ million)
- Exhibit 65: Data Table on Others – Market size and forecast 2022-2027 ($ million)
- Exhibit 66: Chart on Others – Year-over-year growth 2022-2027 (%)
- Exhibit 67: Data Table on Others – Year-over-year growth 2022-2027 (%)
- 7.7 Market opportunity by Application
- Exhibit 68: Market opportunity by Application ($ million)
- Exhibit 69: Data Table on Market opportunity by Application ($ million)
8 Customer Landscape
- 8.1 Customer landscape overview
- Exhibit 70: Analysis of price sensitivity, lifecycle, customer purchase basket, adoption rates, and purchase criteria
9 Geographic Landscape
- 9.1 Geographic segmentation
- Exhibit 71: Chart on Market share by geography 2022-2027 (%)
- Exhibit 72: Data Table on Market share by geography 2022-2027 (%)
- 9.2 Geographic comparison
- Exhibit 73: Chart on Geographic comparison
- Exhibit 74: Data Table on Geographic comparison
- 9.3 North America – Market size and forecast 2022-2027
- Exhibit 75: Chart on North America – Market size and forecast 2022-2027 ($ million)
- Exhibit 76: Data Table on North America – Market size and forecast 2022-2027 ($ million)
- Exhibit 77: Chart on North America – Year-over-year growth 2022-2027 (%)
- Exhibit 78: Data Table on North America – Year-over-year growth 2022-2027 (%)
- 9.4 Europe – Market size and forecast 2022-2027
- Exhibit 79: Chart on Europe – Market size and forecast 2022-2027 ($ million)
- Exhibit 80: Data Table on Europe – Market size and forecast 2022-2027 ($ million)
- Exhibit 81: Chart on Europe – Year-over-year growth 2022-2027 (%)
- Exhibit 82: Data Table on Europe – Year-over-year growth 2022-2027 (%)
- 9.5 Asia – Market size and forecast 2022-2027
- Exhibit 83: Chart on Asia – Market size and forecast 2022-2027 ($ million)
- Exhibit 84: Data Table on Asia – Market size and forecast 2022-2027 ($ million)
- Exhibit 85: Chart on Asia – Year-over-year growth 2022-2027 (%)
- Exhibit 86: Data Table on Asia – Year-over-year growth 2022-2027 (%)
- 9.6 Rest of World (ROW) – Market size and forecast 2022-2027
- Exhibit 87: Chart on Rest of World (ROW) – Market size and forecast 2022-2027 ($ million)
- Exhibit 88: Data Table on Rest of World (ROW) – Market size and forecast 2022-2027 ($ million)
- Exhibit 89: Chart on Rest of World (ROW) – Year-over-year growth 2022-2027 (%)
- Exhibit 90: Data Table on Rest of World (ROW) – Year-over-year growth 2022-2027 (%)
- 9.7 US – Market size and forecast 2022-2027
- Exhibit 91: Chart on US – Market size and forecast 2022-2027 ($ million)
- Exhibit 92: Data Table on US – Market size and forecast 2022-2027 ($ million)
- Exhibit 93: Chart on US – Year-over-year growth 2022-2027 (%)
- Exhibit 94: Data Table on US – Year-over-year growth 2022-2027 (%)
- 9.8 China – Market size and forecast 2022-2027
- Exhibit 95: Chart on China – Market size and forecast 2022-2027 ($ million)
- Exhibit 96: Data Table on China – Market size and forecast 2022-2027 ($ million)
- Exhibit 97: Chart on China – Year-over-year growth 2022-2027 (%)
- Exhibit 98: Data Table on China – Year-over-year growth 2022-2027 (%)
- 9.9 India – Market size and forecast 2022-2027
- Exhibit 99: Chart on India – Market size and forecast 2022-2027 ($ million)
- Exhibit 100: Data Table on India – Market size and forecast 2022-2027 ($ million)
- Exhibit 101: Chart on India – Year-over-year growth 2022-2027 (%)
- Exhibit 102: Data Table on India – Year-over-year growth 2022-2027 (%)
- 9.10 Japan – Market size and forecast 2022-2027
- Exhibit 103: Chart on Japan – Market size and forecast 2022-2027 ($ million)
- Exhibit 104: Data Table on Japan – Market size and forecast 2022-2027 ($ million)
- Exhibit 105: Chart on Japan – Year-over-year growth 2022-2027 (%)
- Exhibit 106: Data Table on Japan – Year-over-year growth 2022-2027 (%)
- 9.11 UK – Market size and forecast 2022-2027
- Exhibit 107: Chart on UK – Market size and forecast 2022-2027 ($ million)
- Exhibit 108: Data Table on UK – Market size and forecast 2022-2027 ($ million)
- Exhibit 109: Chart on UK – Year-over-year growth 2022-2027 (%)
- Exhibit 110: Data Table on UK – Year-over-year growth 2022-2027 (%)
- 9.12 Market opportunity by geography
- Exhibit 111: Market opportunity by geography ($ million)
- Exhibit 112: Data Tables on Market opportunity by geography ($ million)
10 Drivers, Challenges, and Trends
- 10.3 Impact of drivers and challenges
- Exhibit 113: Impact of drivers and challenges in 2022 and 2027
11 Vendor Landscape
- 11.2 Vendor landscape
- Exhibit 114: Overview on Criticality of inputs and Factors of differentiation
- 11.3 Landscape disruption
- Exhibit 115: Overview on factors of disruption
- 11.4 Industry risks
- Exhibit 116: Impact of key risks on business
12 Vendor Analysis
- 12.1 Vendors covered
- Exhibit 117: Vendors covered
- 12.2 Market positioning of vendors
- Exhibit 118: Matrix on vendor position and classification
- 12.3 Arthrex Inc.
- Exhibit 119: Arthrex Inc. – Overview
- Exhibit 120: Arthrex Inc. – Product / Service
- Exhibit 121: Arthrex Inc. – Key offerings
- 12.4 Bonalive Biomaterials Ltd.
- Exhibit 122: Bonalive Biomaterials Ltd. – Overview
- Exhibit 123: Bonalive Biomaterials Ltd. – Product / Service
- Exhibit 124: Bonalive Biomaterials Ltd. – Key offerings
- 12.5 Ferro Corp.
- Exhibit 125: Ferro Corp. – Overview
- Exhibit 126: Ferro Corp. – Business segments
- Exhibit 127: Ferro Corp. – Key offerings
- Exhibit 128: Ferro Corp. – Segment focus
- 12.6 GlaxoSmithKline Plc
- Exhibit 129: GlaxoSmithKline Plc – Overview
- Exhibit 130: GlaxoSmithKline Plc – Business segments
- Exhibit 131: GlaxoSmithKline Plc – Key news
- Exhibit 132: GlaxoSmithKline Plc – Key offerings
- Exhibit 133: GlaxoSmithKline Plc – Segment focus
- 12.7 Johnson and Johnson Services Inc.
- Exhibit 134: Johnson and Johnson Services Inc. – Overview
- Exhibit 135: Johnson and Johnson Services Inc. – Business segments
- Exhibit 136: Johnson and Johnson Services Inc. – Key news
- Exhibit 137: Johnson and Johnson Services Inc. – Key offerings
- Exhibit 138: Johnson and Johnson Services Inc. – Segment focus
- 12.8 LASAK s.r.o.
- Exhibit 139: LASAK s.r.o. – Overview
- Exhibit 140: LASAK s.r.o. – Product / Service
- Exhibit 141: LASAK s.r.o. – Key offerings
- 12.9 Matexcel
- Exhibit 142: Matexcel – Overview
- Exhibit 143: Matexcel – Product / Service
- Exhibit 144: Matexcel – Key offerings
- 12.10 Merck KGaA
- Exhibit 145: Merck KGaA – Overview
- Exhibit 146: Merck KGaA – Business segments
- Exhibit 147: Merck KGaA – Key news
- Exhibit 148: Merck KGaA – Key offerings
- Exhibit 149: Merck KGaA – Segment focus
- 12.11 Mo-Sci Corp.
- Exhibit 150: Mo-Sci Corp. – Overview
- Exhibit 151: Mo-Sci Corp. – Product / Service
- Exhibit 152: Mo-Sci Corp. – Key offerings
- 12.12 NORAKER
- Exhibit 153: NORAKER – Overview
- Exhibit 154: NORAKER – Product / Service
- Exhibit 155: NORAKER – Key offerings
- 12.13 NovaBone Products LLC
- Exhibit 156: NovaBone Products LLC – Overview
- Exhibit 157: NovaBone Products LLC – Product / Service
- Exhibit 158: NovaBone Products LLC – Key offerings
- 12.14 SCHOTT AG
- Exhibit 159: SCHOTT AG – Overview
- Exhibit 160: SCHOTT AG – Business segments
- Exhibit 161: SCHOTT AG – Key news
- Exhibit 162: SCHOTT AG – Key offerings
- Exhibit 163: SCHOTT AG – Segment focus
- 12.15 Stryker Corp.
- Exhibit 164: Stryker Corp. – Overview
- Exhibit 165: Stryker Corp. – Business segments
- Exhibit 166: Stryker Corp. – Key news
- Exhibit 167: Stryker Corp. – Key offerings
- Exhibit 168: Stryker Corp. – Segment focus
- 12.16 Synergy Biomedical LLC
- Exhibit 169: Synergy Biomedical LLC – Overview
- Exhibit 170: Synergy Biomedical LLC – Product / Service
- Exhibit 171: Synergy Biomedical LLC – Key offerings
- 12.17 Zimmer Biomet Holdings Inc.
- Exhibit 172: Zimmer Biomet Holdings Inc. – Overview
- Exhibit 173: Zimmer Biomet Holdings Inc. – Business segments
- Exhibit 174: Zimmer Biomet Holdings Inc. – Key news
- Exhibit 175: Zimmer Biomet Holdings Inc. – Key offerings
- Exhibit 176: Zimmer Biomet Holdings Inc. – Segment focus
13 Appendix
- 13.1 Scope of the report
- 13.2 Inclusions and exclusions checklist
- Exhibit 177: Inclusions checklist
- Exhibit 178: Exclusions checklist
- 13.3 Currency conversion rates for US$
- Exhibit 179: Currency conversion rates for US$
- 13.4 Research methodology
- Exhibit 180: Research methodology
- Exhibit 181: Validation techniques employed for market sizing
- Exhibit 182: Information sources
- 13.5 List of abbreviations
- Exhibit 183: List of abbreviations
About Us
Technavio is a leading global technology research and advisory company. Their research and analysis focuses on emerging market trends and provides actionable insights to help businesses identify market opportunities and develop effective strategies to optimize their market positions. With over 500 specialized analysts, Technavio’s report library consists of more than 17,000 reports and counting, covering 800 technologies, spanning across 50 countries. Their client base consists of enterprises of all sizes, including more than 100 Fortune 500 companies. This growing client base relies on Technavio’s comprehensive coverage, extensive research, and actionable market insights to identify opportunities in existing and potential markets and assess their competitive positions within changing market scenarios.
Contact
Technavio Research
Jesse Maida
Media & Marketing Executive
US: +1 844 364 1100
UK: +44 203 893 3200
Email: [email protected]
Website: www.technavio.com
SOURCE Technavio
